Test overview – tasks
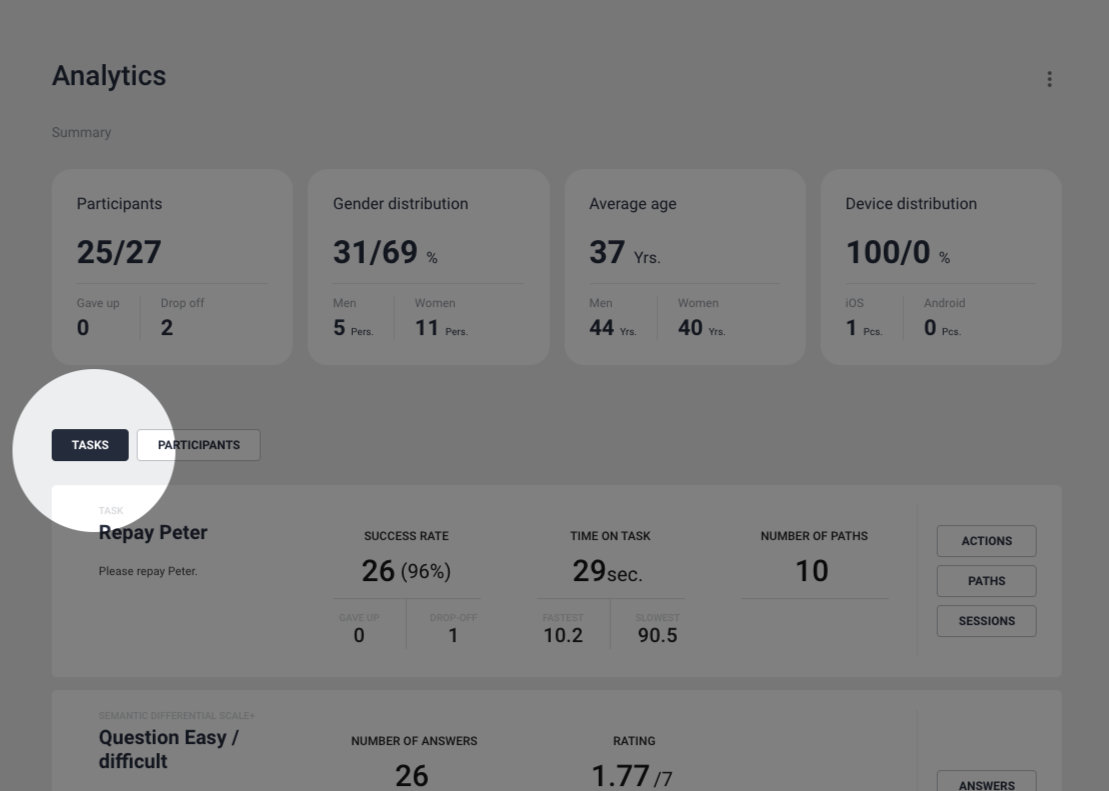
On this level we show the most important accumulated data for each task and question.
Task cards
On each task card, we show Success rate, Time on task, and Number of paths. Furthermore, you access more information under Sessions, Actions and Paths.
In the analytical view, you can fully trust the numbers for ‘Success Rate’ and ‘Gave Up’.
The ‘Drop Off’ calculation is dynamic because participants can exit the test in two different ways: either between tasks or during task execution. We associate drop-offs that occur in between tasks with the next task in the sequence. As a result, the number of drop-offs shown in the task analytics may appear slightly higher than expected.
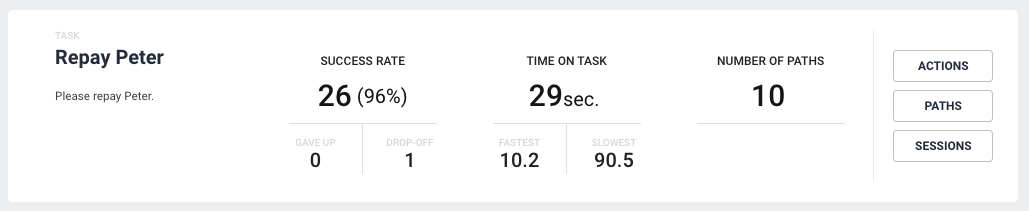
Success rate
Success rate is the number of participants, who completed the task. Together with success rate, we show how many participants gave up on the task and how many dropped off.
Gave up is when the participants click the ‘Give up’-button during the test and give a reason for why they give up.
Drop off is when the participants leave the test without any reason. Be aware that it will take 10 minutes before ‘gave up’ results will show up in Analytics.
Time on task
Time on task is the average time the participants have used to complete the task.Together with time on task, we show the fastest and slowest time for completing the task.
Number of paths
Last, but not least, we show number of different paths the participants have taken to complete the task. You can see each path and how many and which participants have taken the different ones under Paths on the right.
Interaction cost:
Can be calculated by using information about numbers of paths, clicks, scrolls, typing, actions, etc. You need to define what you would like to include in this calculation.
Learnability:
Compare the above metrics in a within-subject study over time – then you can track learnability.
Question cards
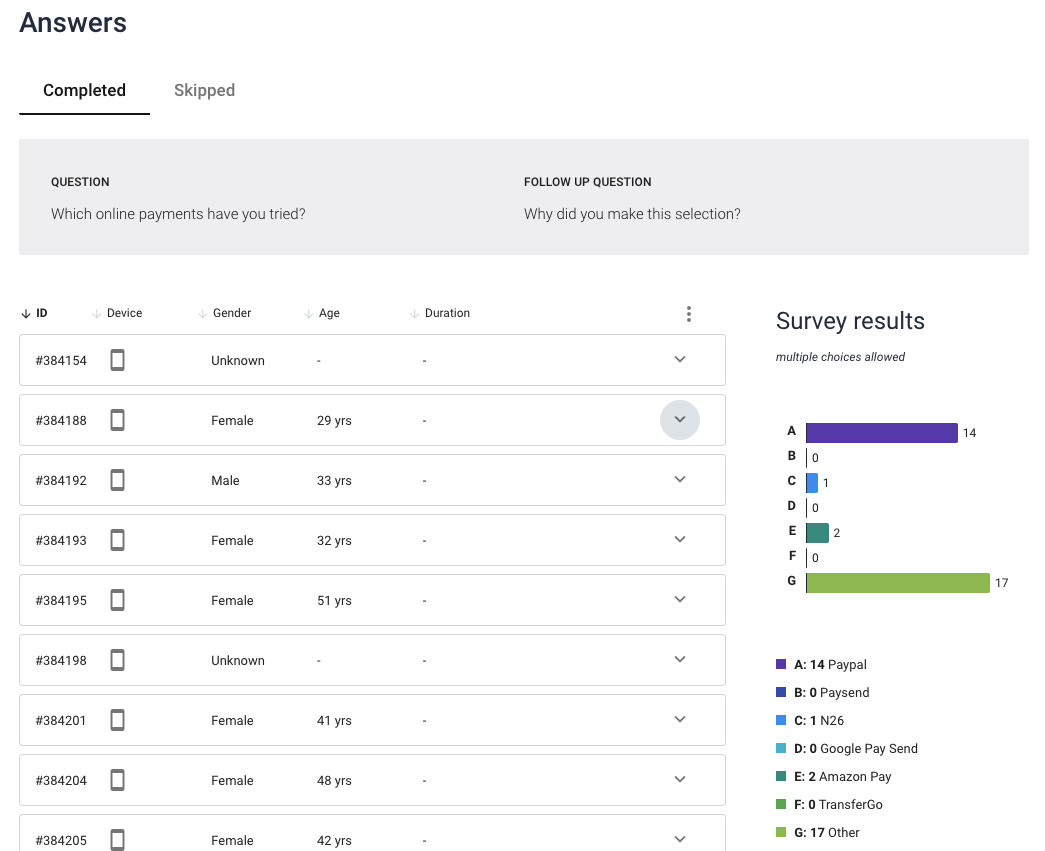
What we show on the question card depends on which answer type you choose when creating the question. We always show Number of answers, Skip and Drop off. A thing to be aware of here, is the ‘+’ after question, this indicated that the question has a follow-up question and you’ll find the responses under Answers on the right.
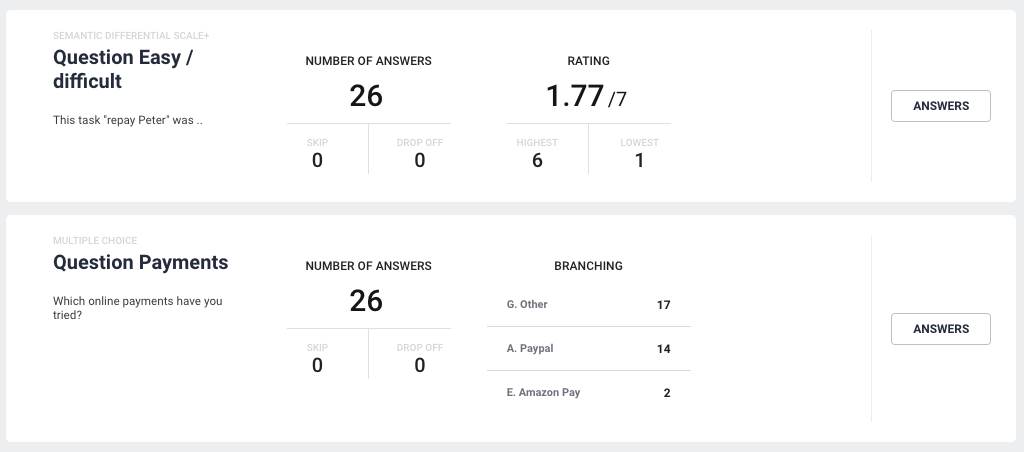
Number of answers
Number of answers is the number of participants, who have answered your question.
Skip is the number of participants, who did not answer the question and clicked ‘skip’ during the test.
Drop off is when the participants leave the test without any reason. Be aware that it will take 10 minutes before ‘gave up’ results will show up in Analytics.
Answer types:
Rating shows average rating, together with the highest rating and the lowest rating given. To see the distribution of ratings and who have given which rating, click ‘Answers’ on the right.
Net Promoster Score (NPS) shows the distribution in Promoters, Passives and Detractors. To see the distribution of ratings and who have given which rating, click ‘Answers’ on the right.
Multiple choice and Yes/No shows the top three most chosen options. To see the distribution of chosen options and who have given which rating, click ‘Answers’ on the right.
Free response is not shown on the question card. Click ‘Answers’ to see all free answers.