AB testing
An AB test is applied when you want to test two versions (A and B) of e.g. different designs, placement of buttons or text, color, but also greater workflows.
General for AB testing
Things to do before conducting the AB test:
- Define which variables you are testing in your design (the difference between A and B)
- Identify which metrics you want to focus on – is it performance metrics (which ones?) or self-reported metrics (which ones?)
- Consider if you need a within- or between-subject design for your test (see Within- & Between Subject)
- For proper statistical analysis, you need to have at least 15 participants per version
Conducting an AB with Preely
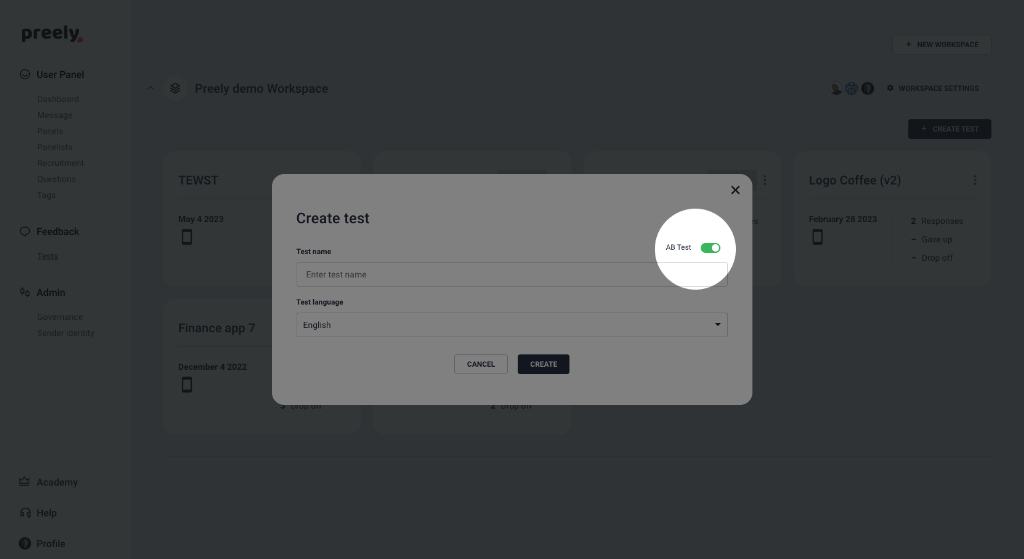
You can conduct an AB test directly on the platform. When you create a new test, enable AB Test.
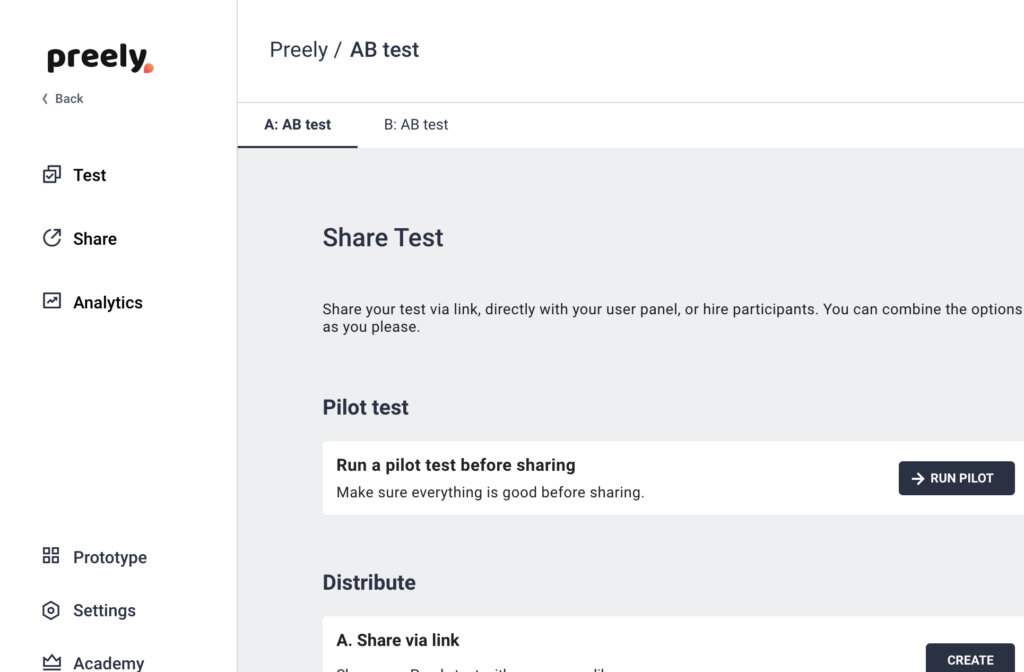
Then you’ll have a test with two tabs – A and B.
You create your AB test by adding tasks and questions to tab A (as you normally do in a Preely test). All tasks and questions are automatically cloned to tab B. The only thing you need to do on tab B is to add the prototype you can’t test, and define start and end screens.
Note that only tasks and questions are enabled.
Share an AB test on the platform
Then you are ready to share the tests.
Here you again have two tabs, where you share test A on tab A and test B on tab B. This does that you can test the different variants with different segments.
Analytics on the platform
For the analysis, you should focus on the metrics you defined before conducting the test and compare them to each other. We provide you with a summary page, where data for the two tests are summed up and where we have applied a two-sample Student’s t-test to some of the results. We are working with a null hypothesis, stating there is no difference between the two prototypes.
To translate this, this means that when the p-value is close to 1, there are no differences in the data. If the p-value is close to 0, there is a difference between the data.
Draw conclusions
The smaller the p probability is, the more significant our result becomes and the more confident we are that our independent variable really did cause the difference. The p-value will be smaller as the difference between the means is greater, as the variability between our observations within a condition (standard deviation) is less, and as the sample size of the experiment increases (more participants or more measurements per participant). A greater sample size gives our experiment greater statistical power to find significant differences.
Within your organization you need to decide when the p-value is significant, often we operate a confidence interval of 95% and therefore want a p-value that is less than 0.05 to be significant. Then, if the p-value is less than 0.05 we conclude that the results are not due to change, but an effect of the independent variable.