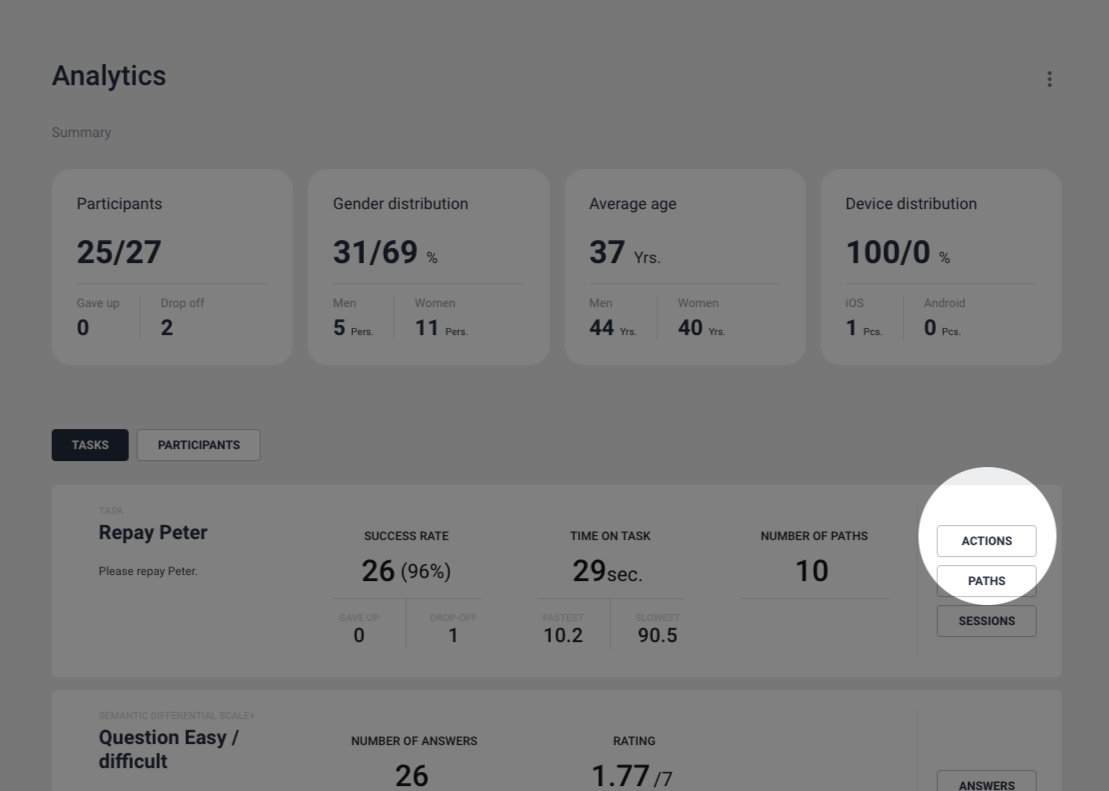
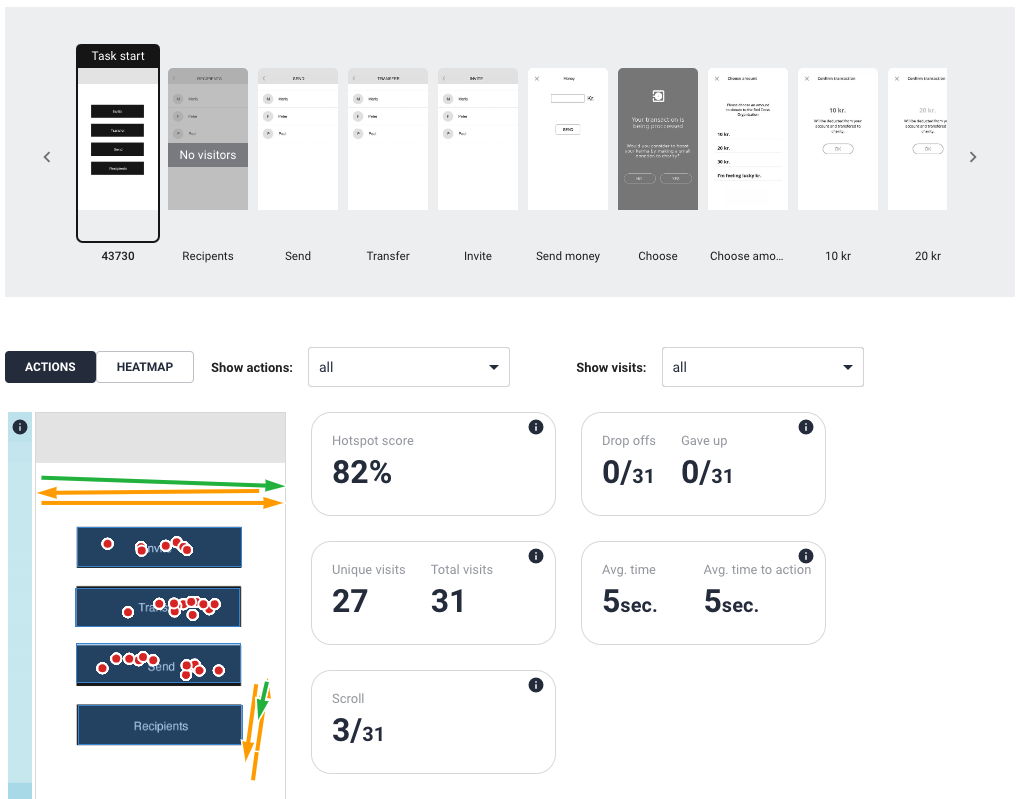
Actions and heatmaps
This gives a very good indicator of the participants’ mental models of your prototype and how they expect the navigation to be (together with paths). It also gives great insight into the wording of menu and button labelling and whether it works or not. Furthermore, you can see scrolls and swipes giving you an indication of how the participants have (or want to) interact with your product.
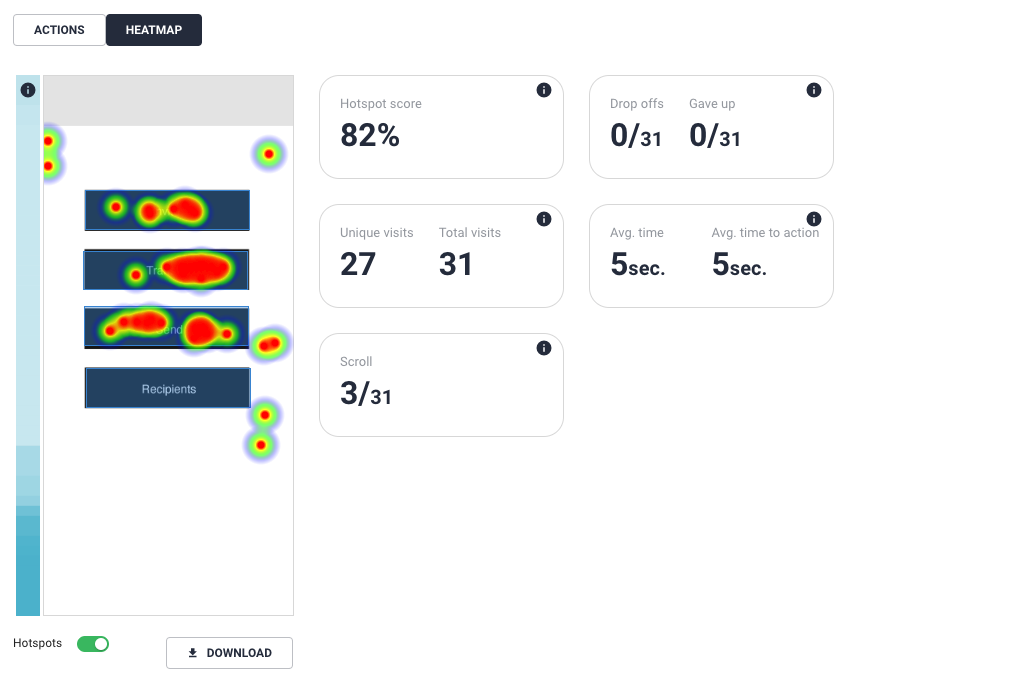
Screen statistics
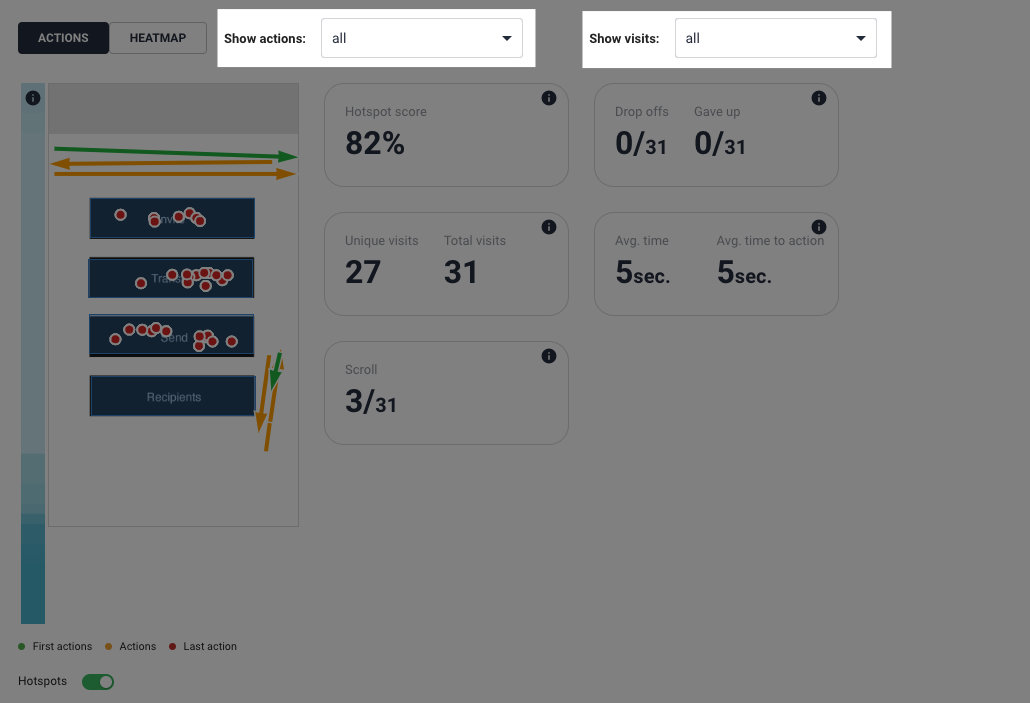
Hotspot score:
You want this number to be high. If it’s low it shows that your participants struggle to find their way around your prototype due to e.g. labeling of menus and buttons
Drop offs and Gave up
Shows participants who drop off or give op on this screen
Total visits compared to Unique visits:
When the total number of visits is high compared to unique visits, this indicates confusion by showing that participants search for a long time or start over several times
Avg. time on screen
is a good indicator for how difficult the task is
Avg. time to first action:
Indicates how big the participants’ cognitive strain have been
Link spots
You can click on the different Link spots and see how many have click in that specific area.
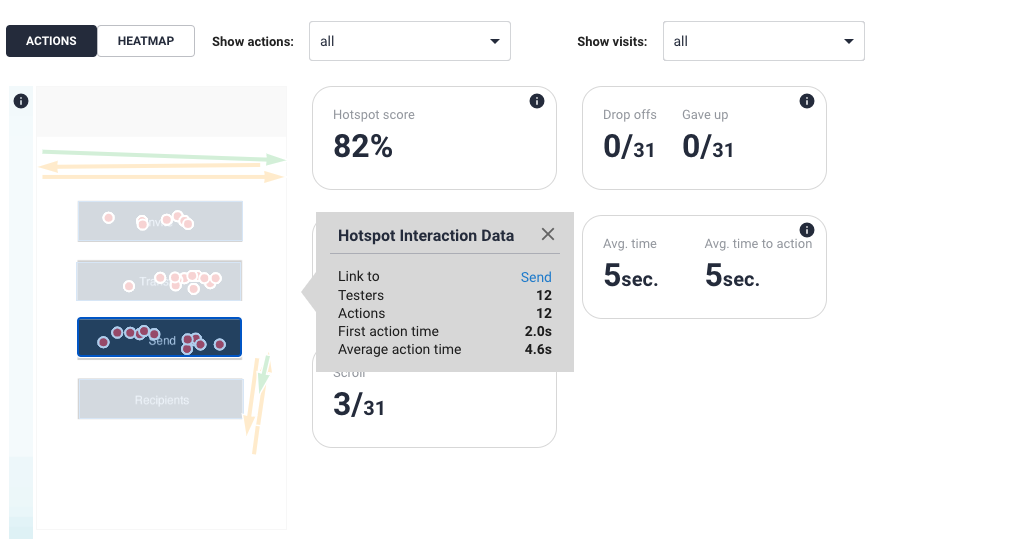
You can also mouse click + hold to mark an area.
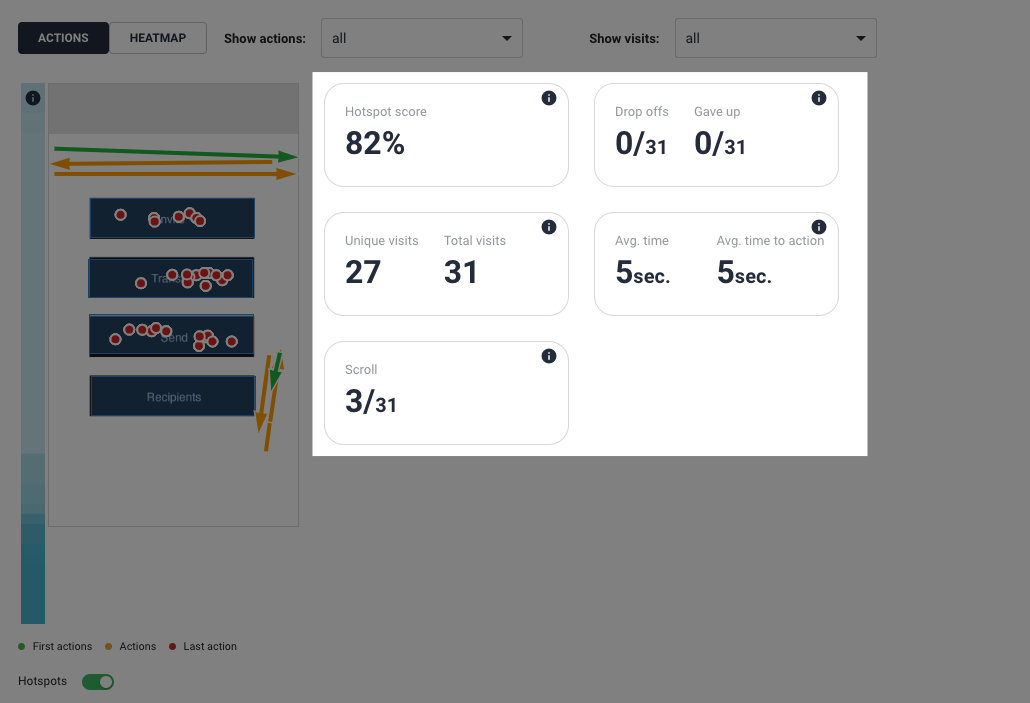
First and last action
You can see actions as All actions, First action or Last action, together with the information on how the participants have interacted first time, second time, etc. they have visited the screen.
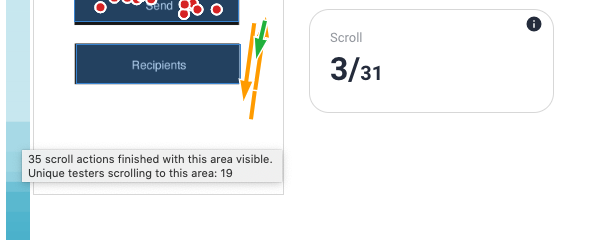
See scrolls
Shows how many scrolls finished in the area and the number of unique participants who scrolled into the area.
Figma note!
The scroll heatmap is not support for prototypes imported with a Figma link.
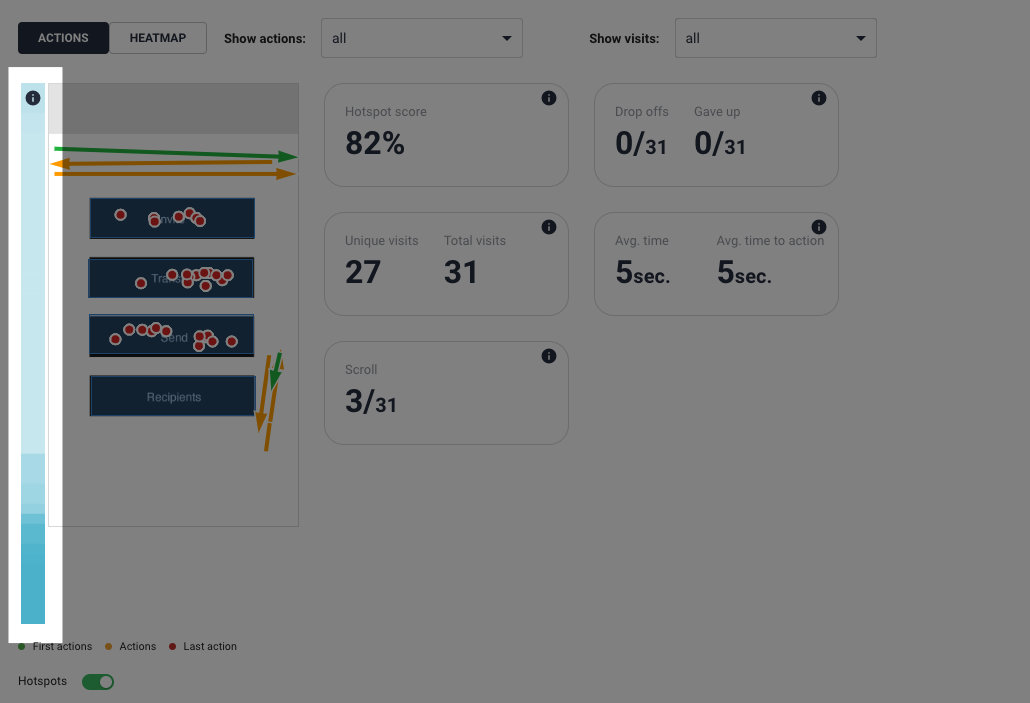
Mouse over the blue area to see statistics.
Heatmaps
Choose Heatmaps