Summary
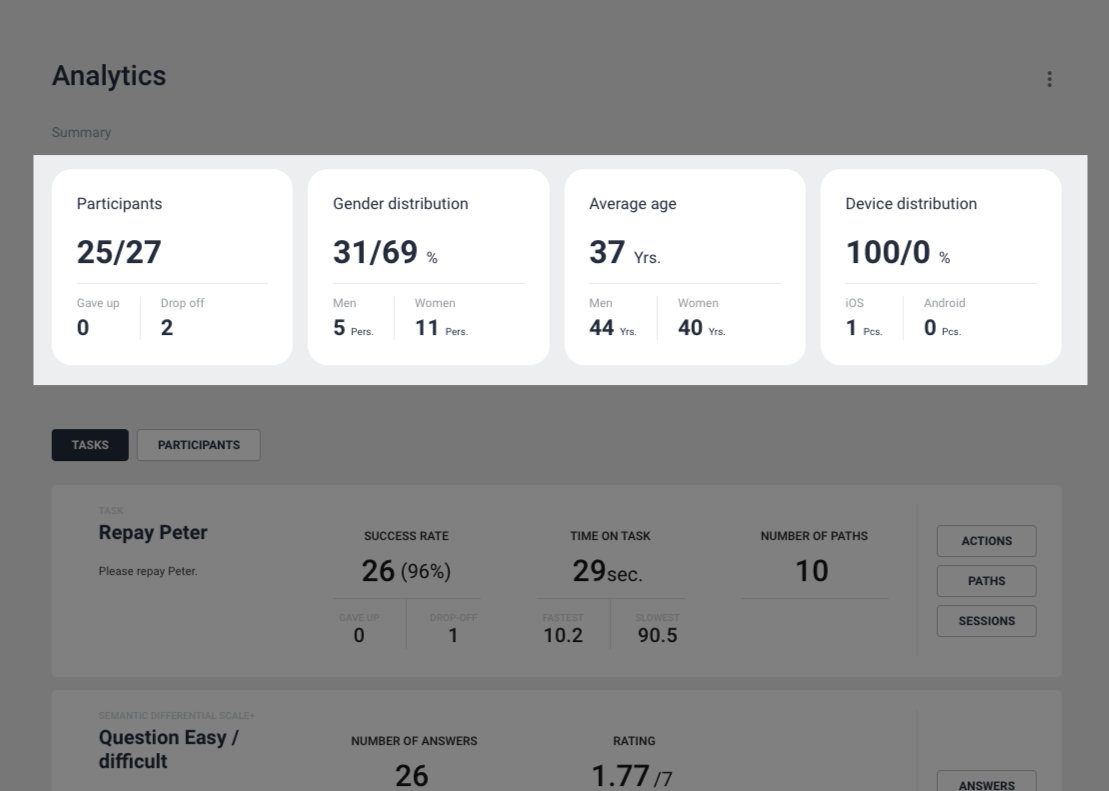
Here you get a quick overview of test participants and their demographic data. Note that asking for demographic data can be set to mandatory or optional when designing the test, hence you might not that demographic data from all your participants.
Participants
In the first area, you see the number of participants who have completed the test versus the total number of participants who have started the test.
Under these two numbers, you see how many of the participants, who did not complete the test devided into who gave up and who dropped off.
Gave up is when the participants click the ‘Give up’-button during the test and give a reason for why they give up.
Drop off is when the participants leave the test without any reason. Be aware that it will take 10 minutes before ‘gave up’ results will show up in Analytics.
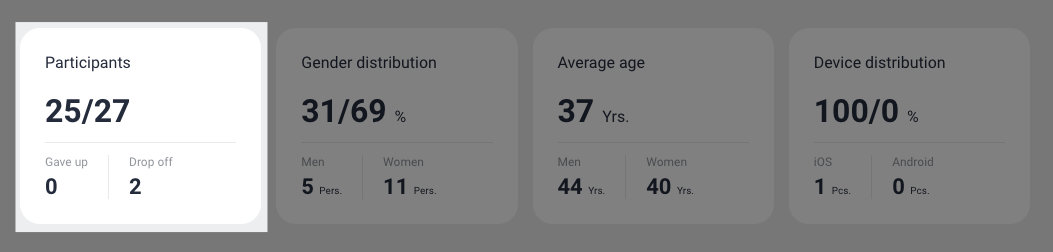
Example:
Here 25 participants have completed the test and 27 have started the test. This means that 2 participants have not completed the test. In this example we do not have anyone who gave up, but we have 2 who dropped off without any reason.
Gender distribution
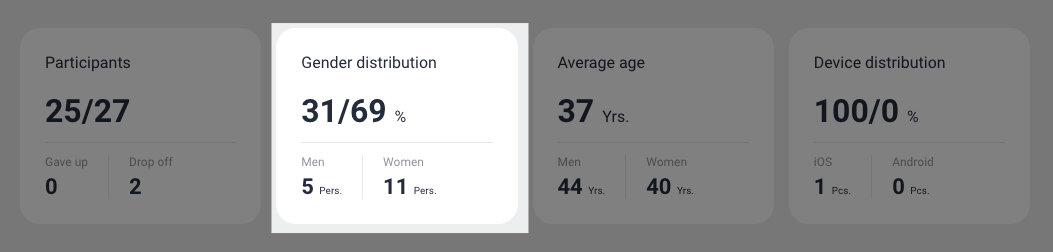
Gender distribution shows the distribution in % and underneath in numbers.
In the example, demographical data was optional, that is why the total number of men and women does not correspond with the total number of participants.
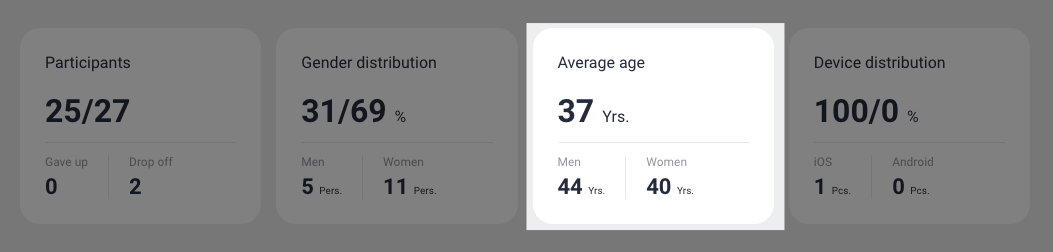
Average age
Device distribution
Here you see the average age of the participants and the average age of men and women. Again, be aware of demografic data set as mandatory or optional.
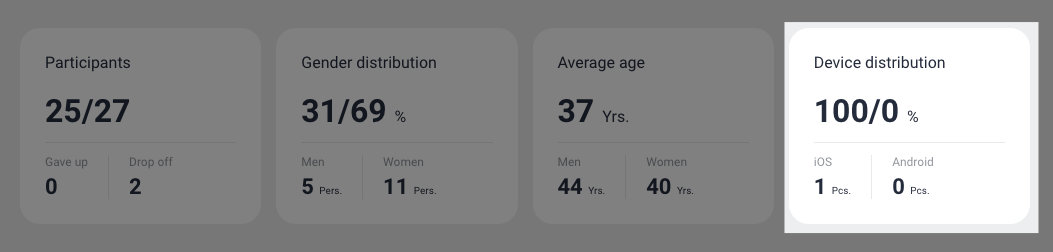
Here you see how many participants have used iPhones and how many have use Android.
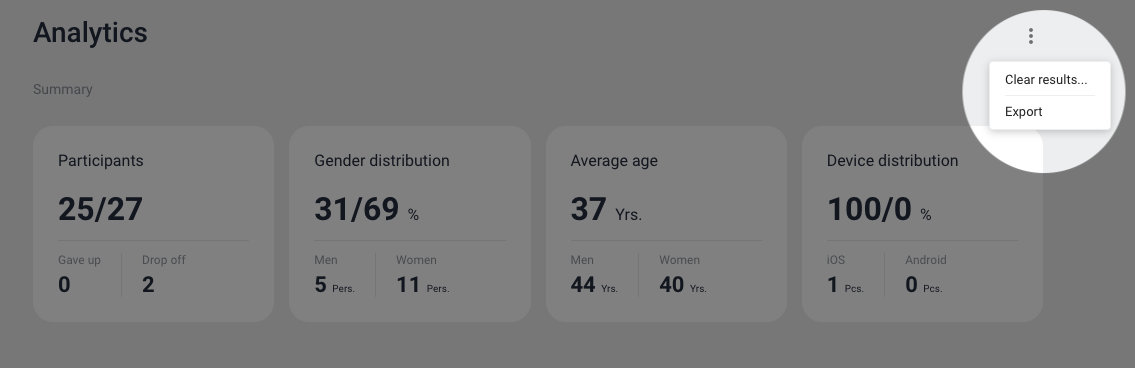
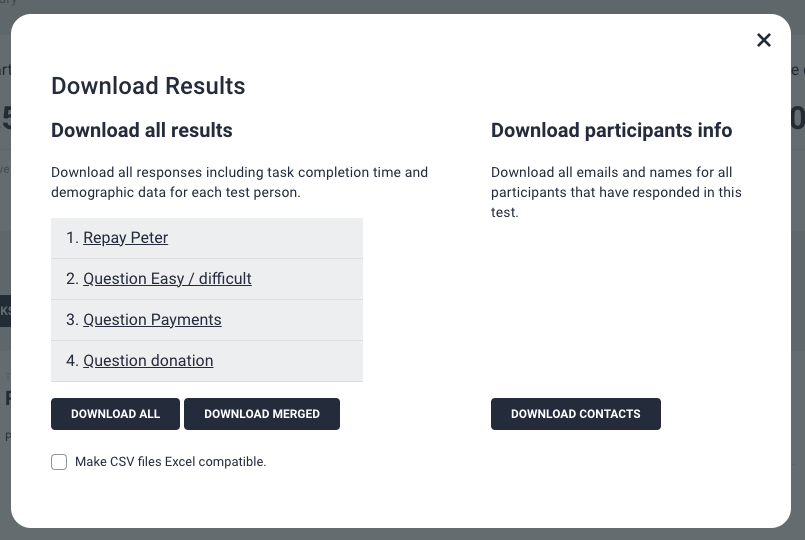
Export data
Download all responses including task completion time and demographic data for each test person.