Gain valuable insights and enhance product decision-making
Achieve fast and easy continuous product discovery, informed decision-making, and obtain valuable insights.
How do you get success with Preely?
Involve users in the product development process.
Involve your users any time as you need them
Test continuously to learn what users do - think - want.
Form user segments based on any criteria
Get valuable user insight fast to make the right decisions.
Involve people across time and place
Insights
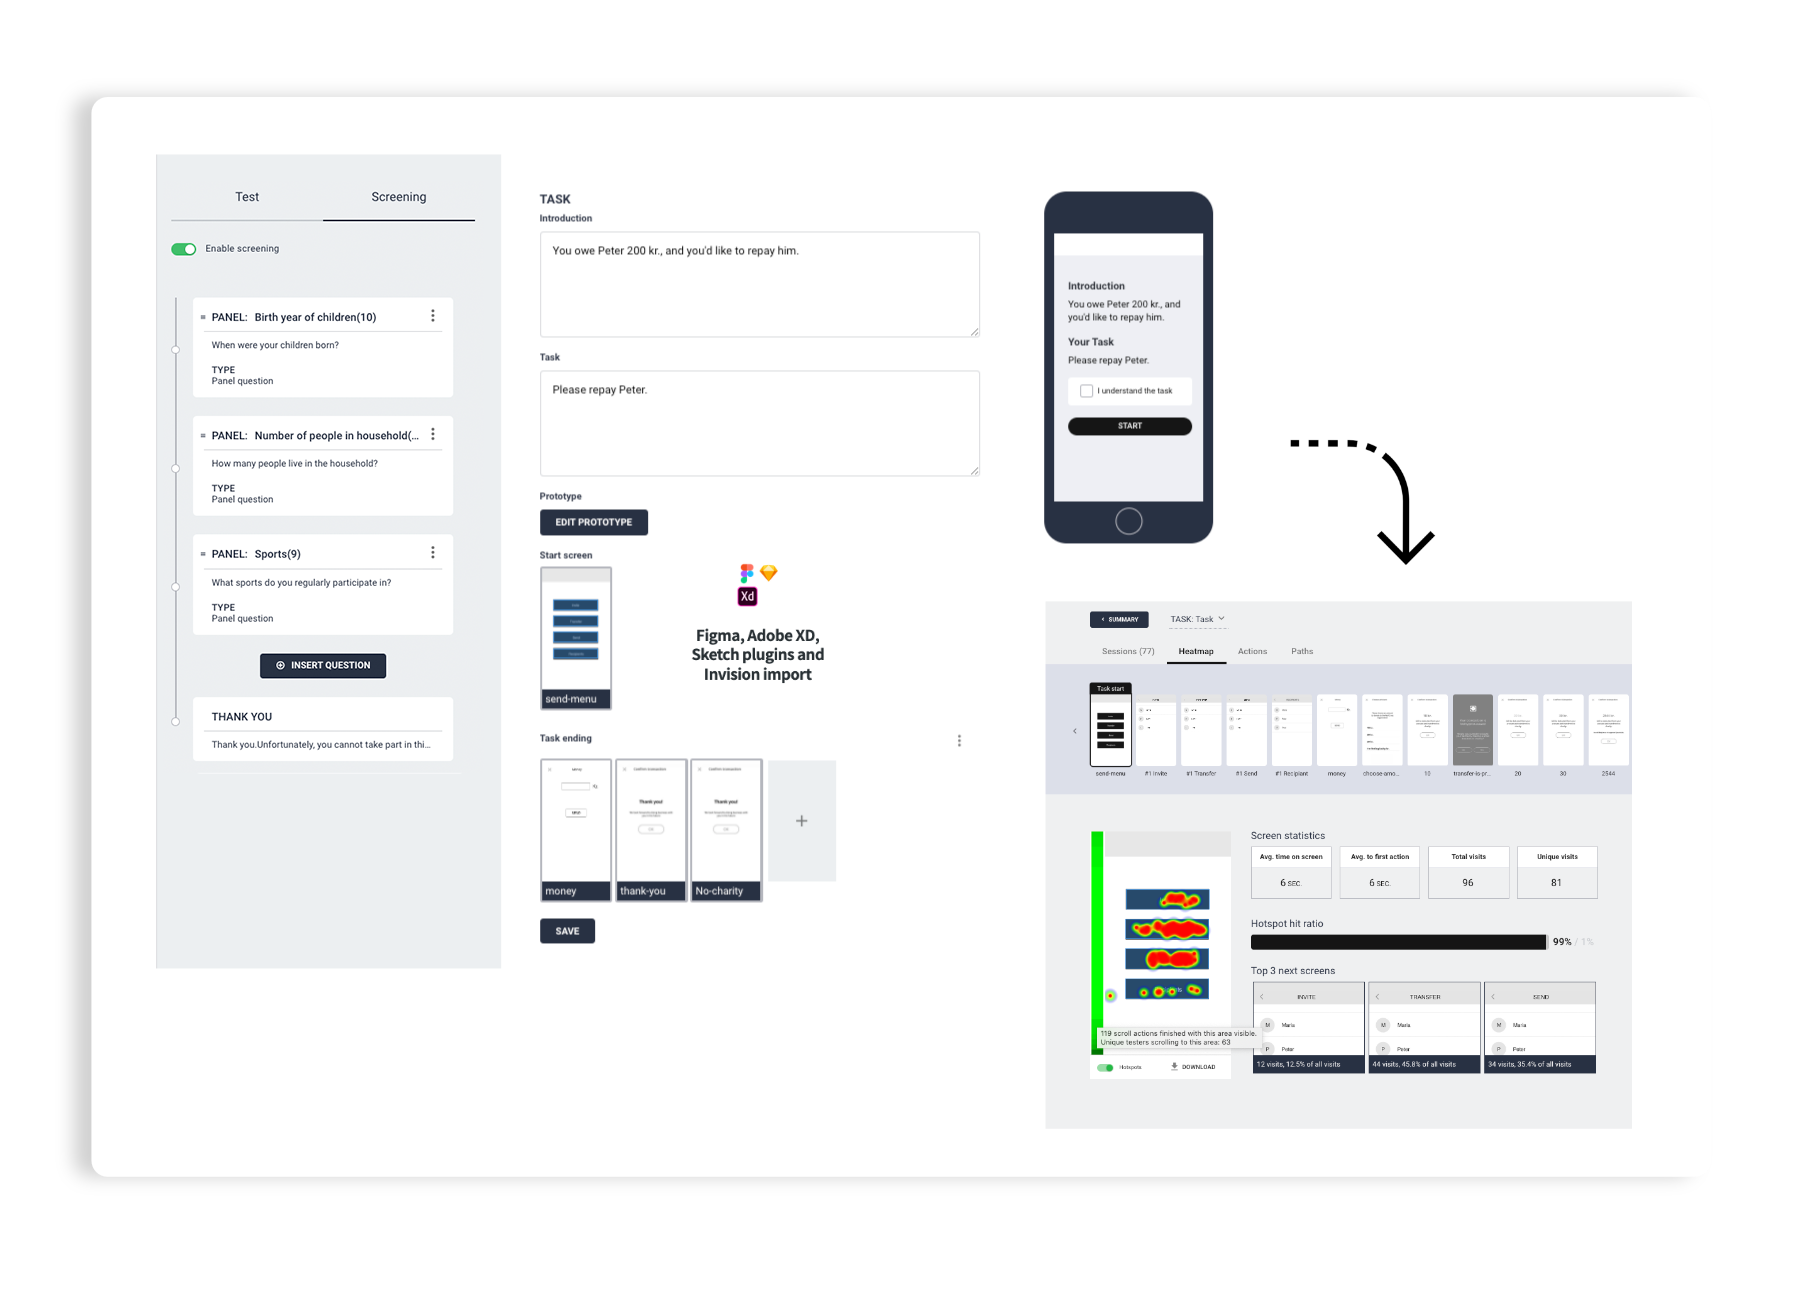
Unlock the power of the Preely feedback tool and experience seamless remote user testing. Test your prototypes effortlessly on various devices - smartphones, tablets, and desktops.
Explore a wide range of testing possibilities, from simple napkin or whiteboard drawings to interactive prototypes created in popular design tools like Adobe XD, Figma, or Sketch.
Preely uses ChatGPT to generate summaries, ratings, and follow-up questions in user test analyses.
User involvement
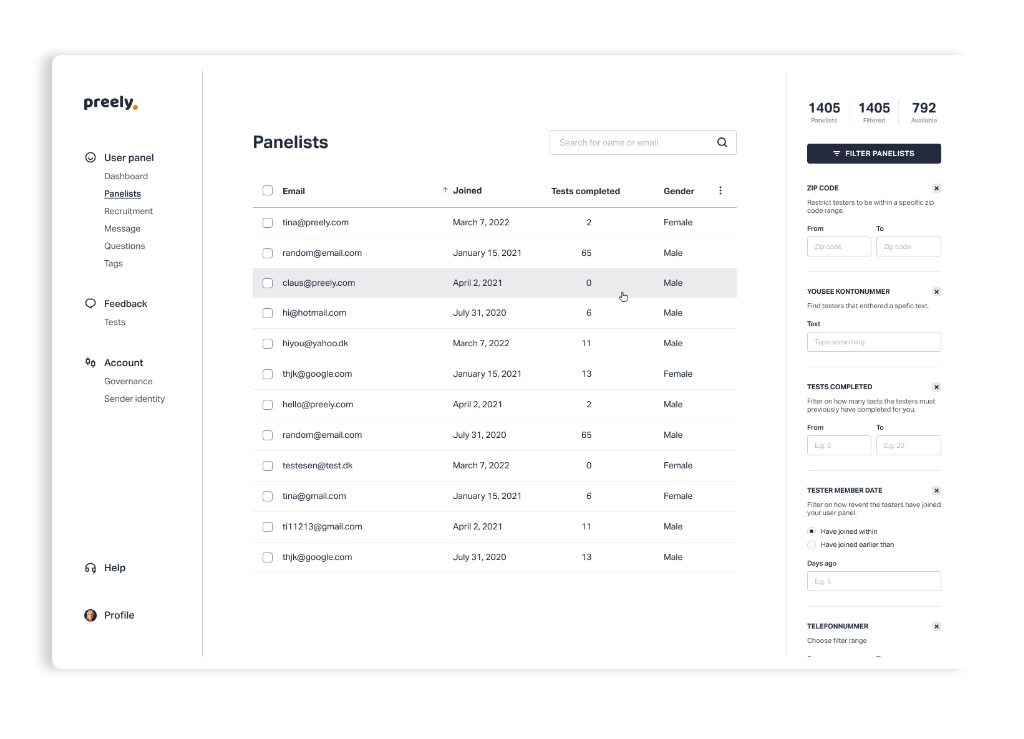
Activate your panel for remote involvement. With Preely you have full access to a reliable user panel recruited by you.
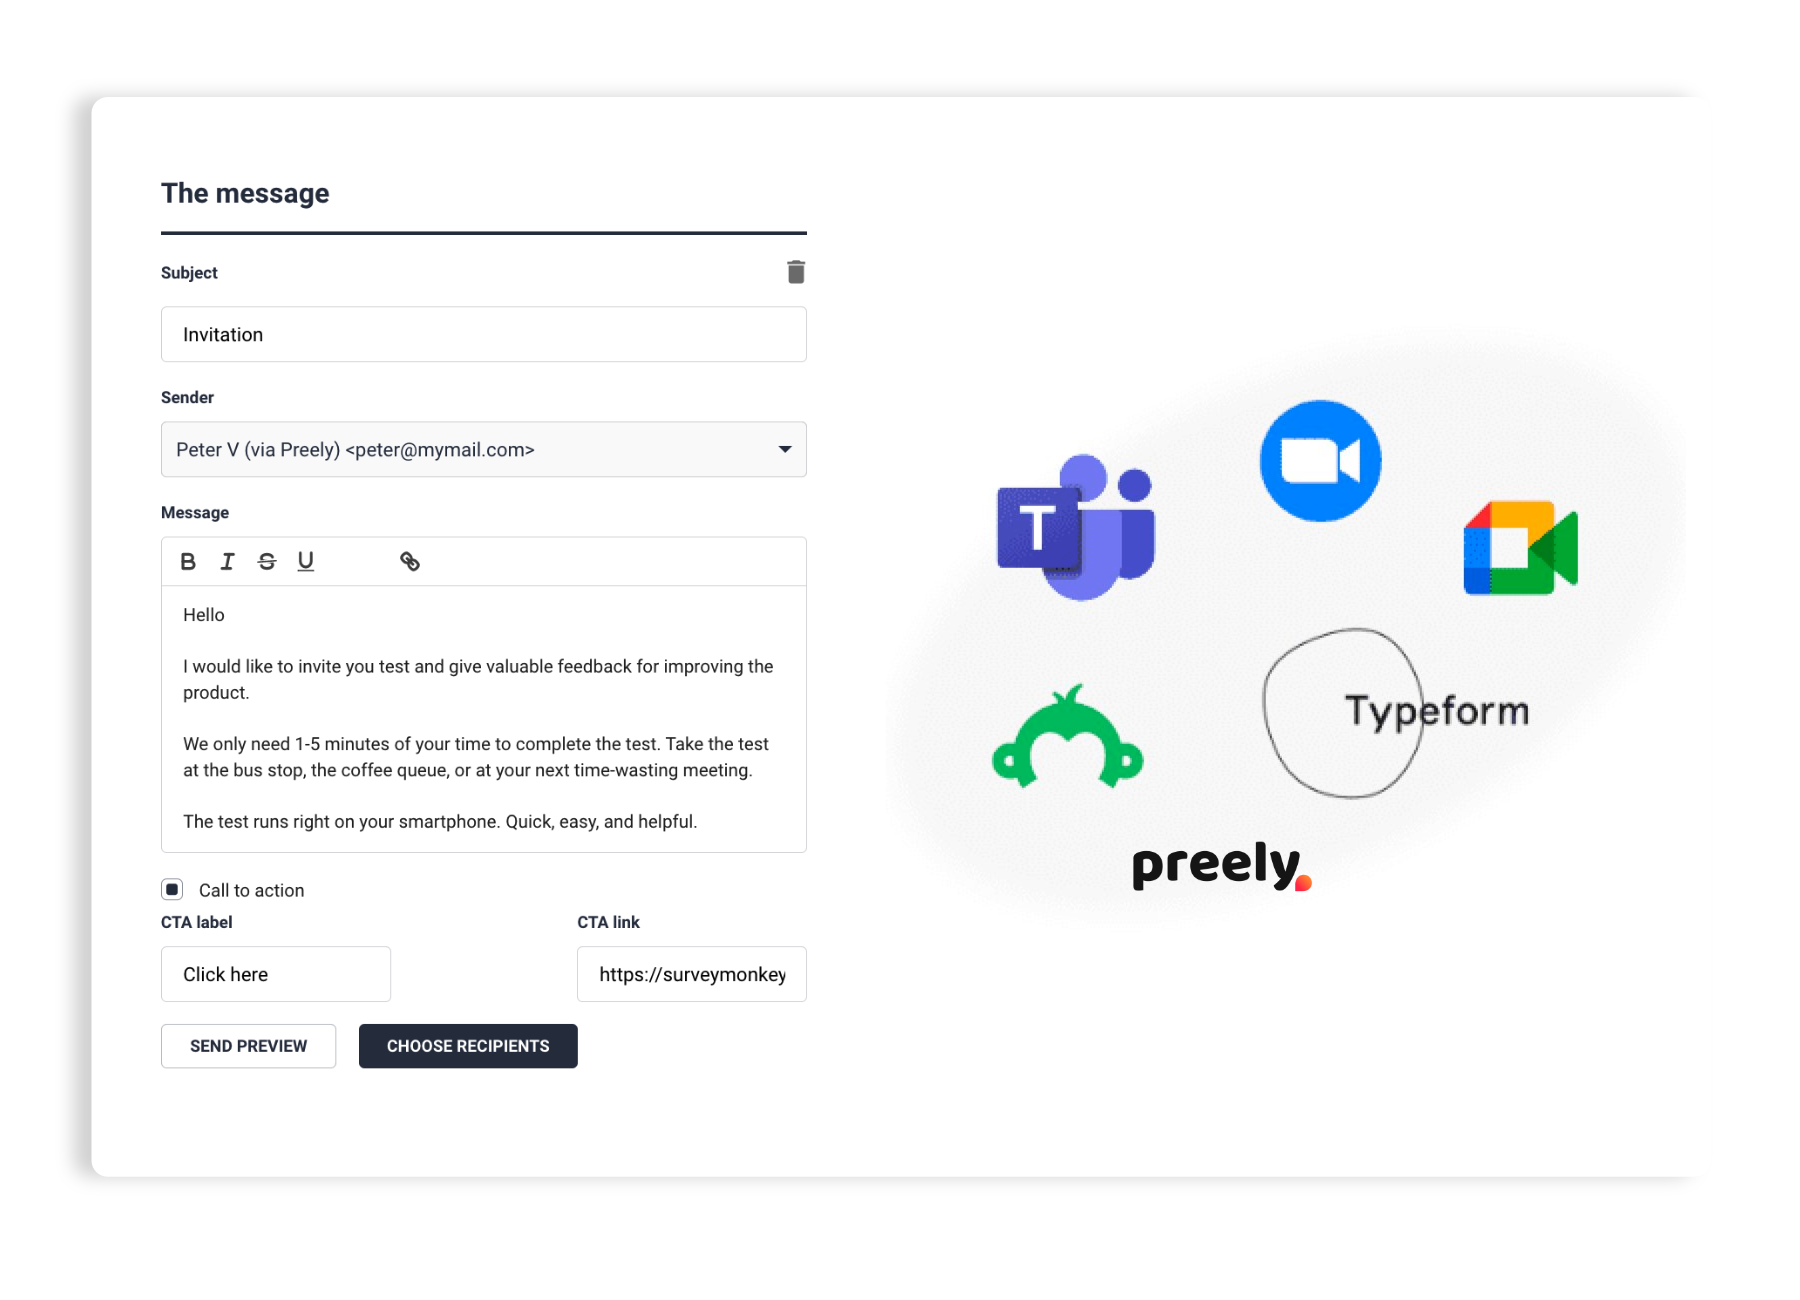
Send invitations to online interviews via Teams, Zoom, Google Meet and more.
Send invitations to surveys on platforms such as SurveyMonkey, Typeform or Google Forms.
Send invitations to participate in a test via Preely feedback module.
● In person online interviews
● Share links to surveys
● Share Preely test
See how TV 2 and YouSee recruit customers

Ready to get started?
Free 14 days trial - No credit card required - Cancel whenever you want