Adobe XD has endorsed Preely as a preferred platform for user testing. Our platform completes your Adobe XD prototyping experience by giving you easy access to test your prototype and get actionable results within no time.
These results can be used to validate assumptions and get new ideas to improve your product. Testing your Adobe XD prototypes brings a lot of value to your designs and thereby your business.
Plugin
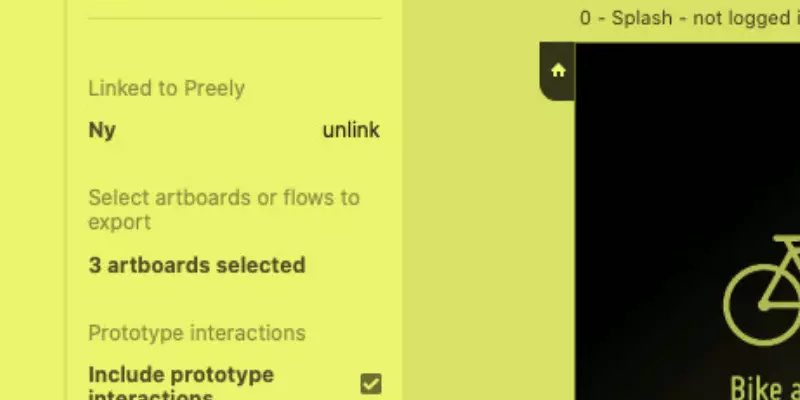
Preely gives you the freedom to conduct remote and unmoderated user tests. The Preely plugin for Adobe XD gives you direct access to the Preely testing platform and in-depth analytics. Just install the plugin and connect your Adobe XD prototype with Preely – select which flows you want to test and export them. With Preely, you can create a test, share it, and get actionable insights and analytics in a short amount of time.
Need help to install the plugin? Go to our Academy and read more.
Types of user tests in Preely
We have designed the platform to be as flexible as possible. This means that you can design the exact test you need. However, we know this can be quite overwhelming, so we have made guidelines for the most common user tests, including usability test, 5-second test, first click test, browsability test, navigation test, preference test, AB test.
What you can measure
With Preely you can measure and track most usability and UX metrics. We talk about two types of metrics: Performance metrics and self-reported metrics.
Performance metrics
Performance metrics are automatically collected in Preely, you do not need to do anything. We collect the following performance metrics:
Success rate:
Whether participants can successfully solve a task or not.
Time on task:
How long it takes for participants to complete a task.
Number of paths:
Number of paths is great for getting insights about navigation and the hierarchical structure of your prototype. Number of paths indicates if the participants are confused. It tracks whether they view multiple pages or try several options before completing the task. The different paths are good indicators for the participants’ mental models (together with Actions & heat map).
Actions & heat map:
We track all clicks and actions participants make when using your prototype. This gives a very good indicator on the participants’ mental models of your prototype and how they expect the navigation to be (together with paths). It also gives great insight into the wording of menu and button labeling and whether it works or not. Furthermore, you can see scrolls and swipes giving you an indication of how the participants have (or want to) interact with your product.
Screen statistics:
Avg. time to first action: Indicates how big the participants’ cognitive strain have been
Total visits compared to Unique visits: When the total number of visits is high compared to unique visits, this indicates confusion by showing that participants search for a long time or start over several times.
Avg. time on screen is a good indicator for how difficult the task is
Hotspot hit ratio: You want this number to be high. If it’s low it shows that your participants struggle to find their way around your prototype due to e.g. labeling of menus and buttons
Top 3 next screens: Great source to learn where your participants search for relevant information
Interaction cost:
Can be calculated by using information about numbers of paths, clicks, scrolls, typing, actions, etc. You need to define what you would like to include in this calculation.
Learnability:
Compare the above metrics in a within-subject study over time – then you can track learnability.
Self-reported Metrics
When you create a test in Preely, you can ask questions and define which answer types you want. Depending on the answer types you choose for your questions, you have different analytics options:
Opinion scales: Likert Scale & Semantic Differential Scale
On the ‘Summary page’ you can see the average rating together with the highest and lowest rating. If you click ‘Answers’ you see the distribution and answers across the scale and you can see who gave which rating.
Read more about Opinion scales: Likert Scale & Semantic Differential Scale here.
Closed-ended questions: Multiple choice and Yes/No
On the ‘Summary page’ you can see a top three of the chosen options for each question. If you click ‘Answers’ you see all chosen answers for the specific question.
Read more about Closed-ended questions: Multiple choice & Yes/No.
Open-ended questions: Free response
On the ‘Summary page’ click ‘Answers’ on the question you want to see answers to, then you’ll see all answers for that specific question.
Read more about Open-ended questions: Free response.
Post test: Net Promoter Score (NPS)
On the ‘Summary page’ you can see how the ratings fall into the three categories. If you click ‘Answers’ you can see who gave which rating.
Read more about Post test: Net Promoter Score (NPS).
Furthermore, we are working on including the System Usability Scale (SUS) on the platform.
Remember you can always go to Preely Academy for more information or send us an email – we are more than happy to help.
Happy testing!








3 Comments
Introducing an updated version of our plugin for Adobe XD - Preely
4 years ago[…] Test your prototype and get actionable results. Adobe XD plugin […]
Beginners guide - Preely
4 years ago[…] Make and organize your prototype and test You can use prototypes created in Adobe XD, Figma, InVision Cloud or Sketch directly in Preely. You can also upload screenshots, mockups, […]
Dynamic input fields - Preely
4 years ago[…] your Adobe XD, Figma, Sketch or InVision Cloud prototype to Preely to enrich it with Preely Forms before you send […]
Comments are closed.