
Net Promoter Score (NPS) is used as a metric of customer loyalty. We normally state that it’s a great metric to collect post-test, when you want to cater for business stakeholders.
NPS is easy to understand and measure, but has limitations for understanding and evaluating UX when used in isolation. It is best used to assess overall customer satisfaction with an entire company or service, or at least with an entire product, not e.g. lower-level details of a redesign.
However, it can be part of different metrics to measure during your user testing, especially if your organization already is measuring NPS on released products (read: you have a great benchmark), and it is a great way to secure buy-in for usability and UX from upper management. And note, NPS correlates well with standard measures of user satisfaction such as System Usability Scale (SUS).
Calculating NPS
When using NPS, you ask your participants: ‘How likely are you to recommend this website/product/service to a friend/relative/colleague?’
The participants score this on a scale from 0-10.
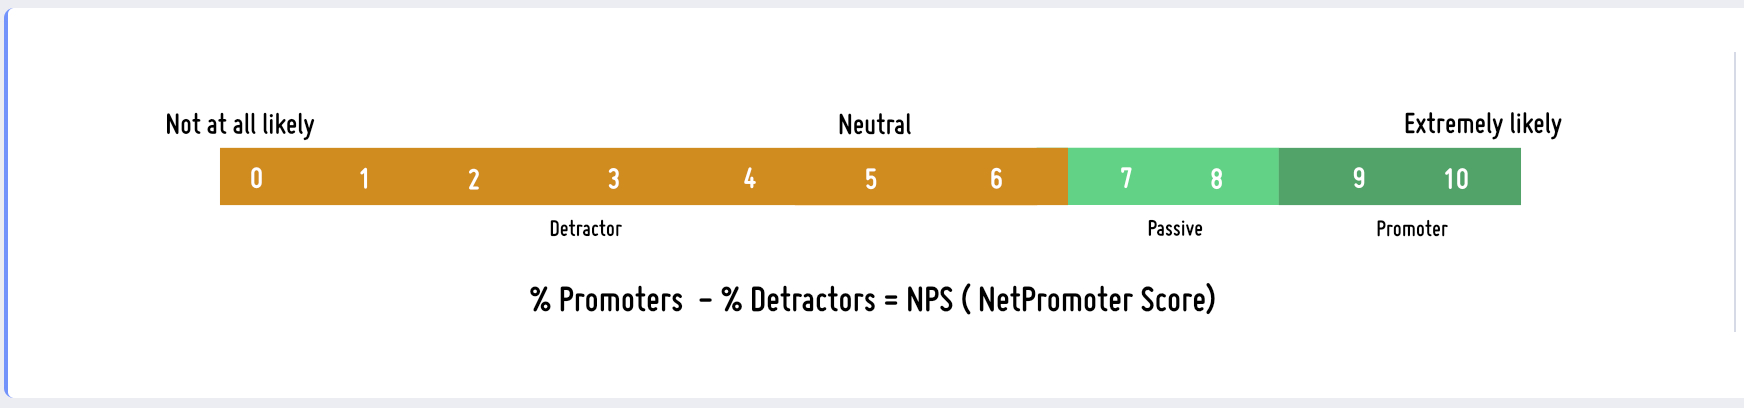
The answers fall into three categories depending on the score:
9 – 10 : Promoters – indicating high satisfaction and a strong likelihood to recommend
7 – 8 : Passives – indicating moderate satisfaction and low likelihood to recommend
0 – 6 : Detractors – tindicating dissatisfaction and likelihood to criticism
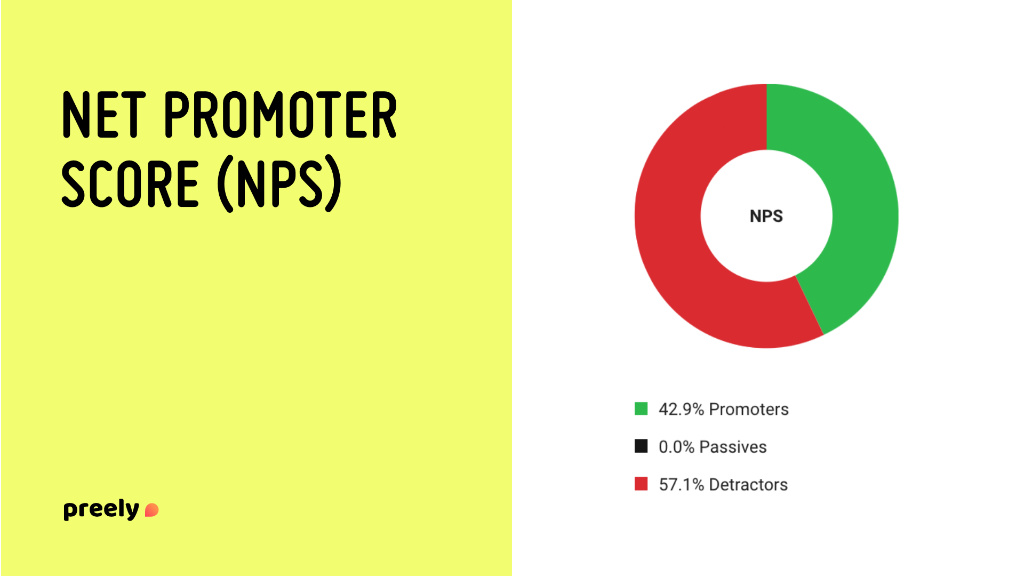
NPS is calculated by subtracting the percentage of detractors from the percentage of promoters, note that the passives are included in the total number of participants, but else those contributions are not used. If you use Preely, all the calculations are done automatically.
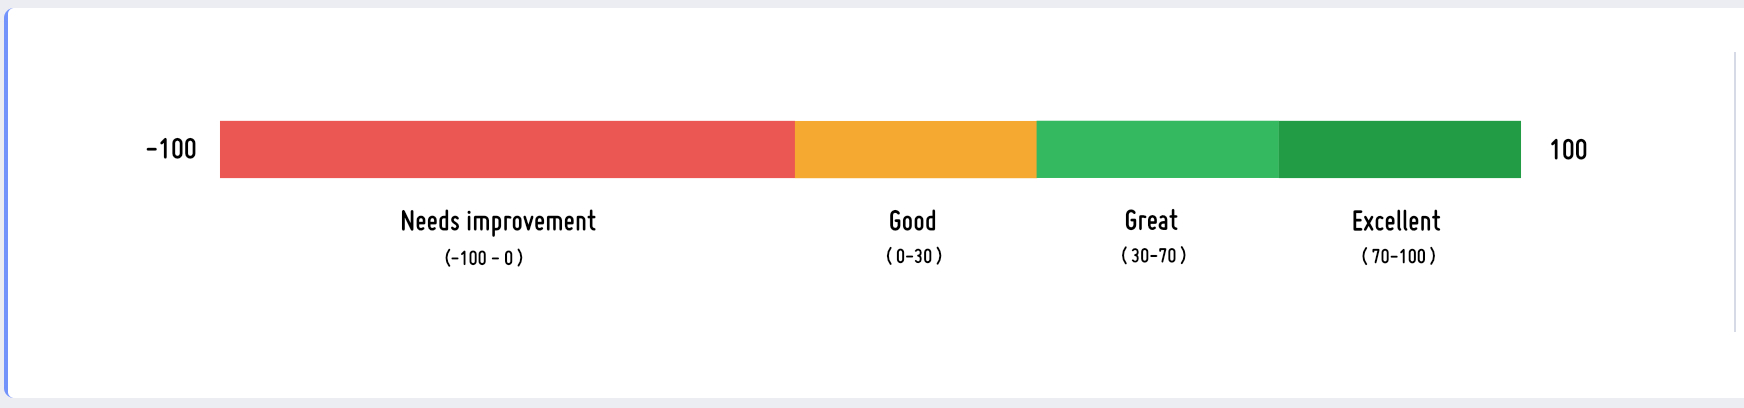
A great benefit about NPS is that it has a built-in benchmark (see below).
Limitations of NPS
As stated in the beginning, NPS has limitations when being used as a usability/UX metric, and it should never stand alone.
– NPS is a marketing tool and it does not capture the full picture of usability
– NPS is a subjective score and sometimes participants will struggle during the test, but still give fairly high score
– NPS is a quantitative metric, hence it can give you an indicator on how your concept or product is doing, but not answer why it’s the case (however you can add a follow-up and have them elaborate their rating)
– Again NPS is a quantitative score, so you need a large enough sample size (see Sample Size)
– A lot of information is ignored due to data being divided into three groups (promoters, passives, and detractors) and passives being completely ignored
– You’ll not be able to use NPS to track minor UX improvements
A final note – do not get disappointed if your company’s overall NPS remains the same, even though you have made great usability and UX improvements. It’s hard to move the needle much on overall customer loyalty. That is why you need to use more usability and UX metrics to measure user satisfaction.