
It is no longer enough to sprinkle UX on the top of product development. UX is becoming a key factor when customers choose a product or want to buy into a brand experience.
Surprisingly, organizations are still struggling to understand the field of UX design – and see the value in investing in this area. Often they are still relying on gut feeling or the designers’ prior experiences, rather than basing decisions on data and insights collected through UX research and user testing. It seems that organizations are still struggling to value UX design as a standalone discipline. A lot of this is due to the complexity of UX and that the positive impact of great UX is hard to measure.
As UX practitioners, we need to be able to articulate user needs as business opportunities and prove the impact of our work. Hence, we need to understand the business, speak the language of business, and be able to put numbers onto experiences, track development and progress over time, and connect our UX work to overall KPIs and OKRs within the organization. This is something many UX practitioners are struggling with, maybe due to the qualitative nature of some of our work. And unfortunately, it seems that in some fractions of the UX community the idea of putting numbers onto experiences is frowned upon.
We need to speak a user-centric business language
We all want a seat at the table in order to get more budget for our work. To get a mandate to speak at the table we need to be able to articulate UX in the language of business. We need to explain to our stakeholders why UX is a key driver both for sales and differentiation and be able to measure it. We need to make the organization understand that great UX leads to success.
So, how do we know if our product is doing well? Businesses are already tracking different established key metrics e.g. page views, clicks, conversions, active users, revenue, churn rate – and they are all well understood. Organizations have set up a system of tracked KPIs to keep an eye on what is important to them, and to be able to tell a story of performance, growth, and in the end; success. These metrics are of interest to us, and we should keep an eye on them too. But they are not telling the whole story of what our users do with our products – if we are in fact meeting their needs. Nor are they helping us learn what is needed to shape future product releases. So in addition to the more ‘traditional’ business metrics, we should implement more user-centered metrics for the product. To understand success and failure, we need to understand what our users do.
Working with the right UX metrics in Preely
We need to be able to convey product performance (both success and failure), while also indicating the level UX of the product. Stating whether the experience was good or bad, intuitive or non-intuitive, is not enough.
By introducing quantitative measures, we can be more precise in describing success, failure, the level of UX, and are able to measure progress throughout the development process. However, this can be a bit tricky since we do not have a one-size-fits-all solution. We need to be able to measure a combination of what people do (actions) and what people think (attitudes).
UX metrics should be based on underlying business criteria. When defining UX metrics we need to define goals and signals.
Goal:
The experience you want your users to have, or how you want your users to engage with your product. It defines how we expect users to behave in order to be successful as a business.
Signal:
Changes in user behaviour, opinion, etc. could indicate success or failure. This defines the signals indicating that the product is doing well.
We need to define goals and signals for each feature or part of the product.
Preely:
Preely collects different types of actions, including success rate, task time, etc. We call them performance metrics. For attitudes, we collect different self-reported metrics e.g. Likert Scale, Semantic Differential Scale, Open-Ended Questions, etc. You can read more about performance- and self-reported metrics here.
We encourage you to start simple – maybe just with success rate and a rating question. Then you can build upon that and also use it as the first baseline for comparison/tracking.
Google HEART
When you are ready to move on from the simple approach, Google has defined a great framework – the HEART framework. It defines five areas of measuring UX. You can read about their framework here. You define which goals are important to you and your organization and then fill in the model, with your own goals and data. The picture shows the HEART framework filled out for an app.
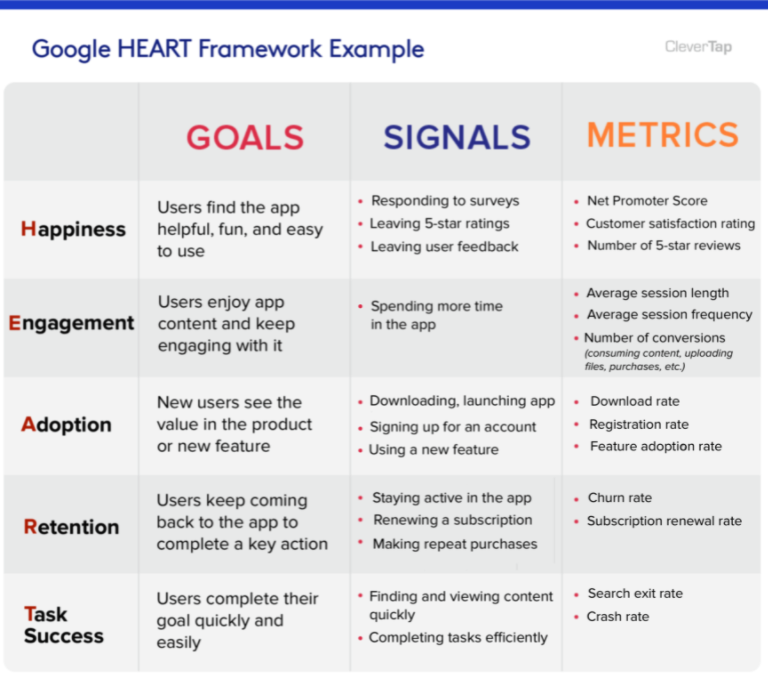
Picture: CleverTap
Bang & Olufsen’s UX KPI & Benchmarking framework
If you are interested in developing your own UX KPI and benchmarking framework. We have written an article about how we developed the Bang & Olufsen’s UX KPI & Benchmarking framework. The beauty of this framework is that it includes the physical experience of a product as well. You can find our paper right here.
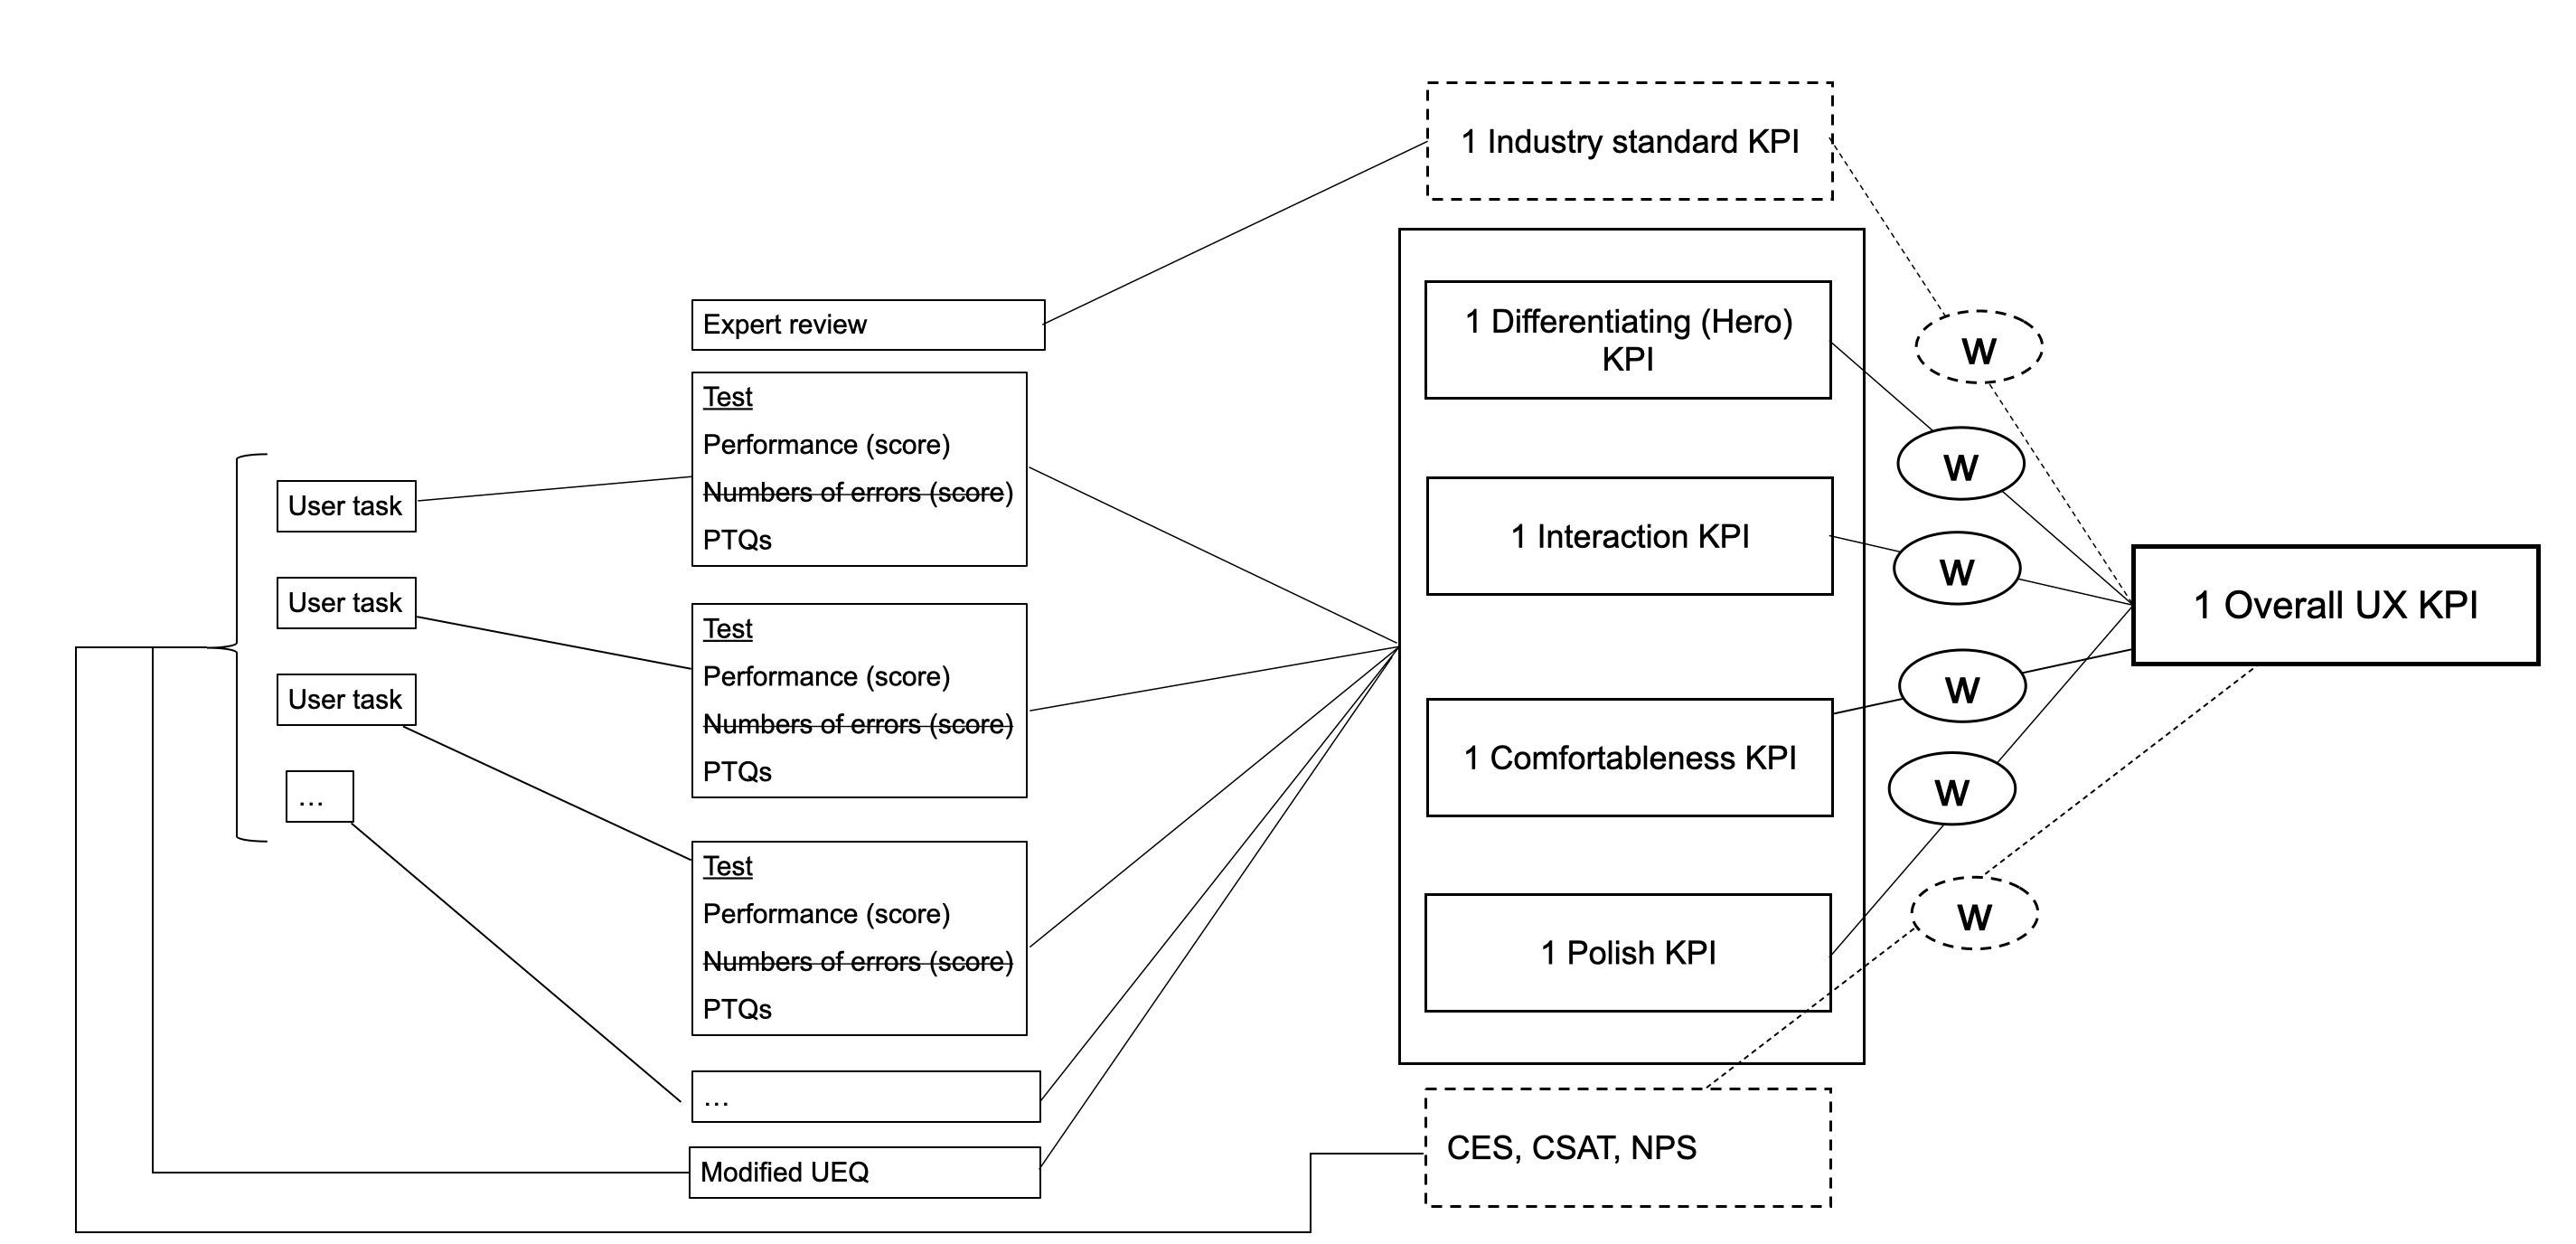
A model of the Bang & Olufsen UX KPI & Benchmarking framework